More Information
view allVideos
Videos
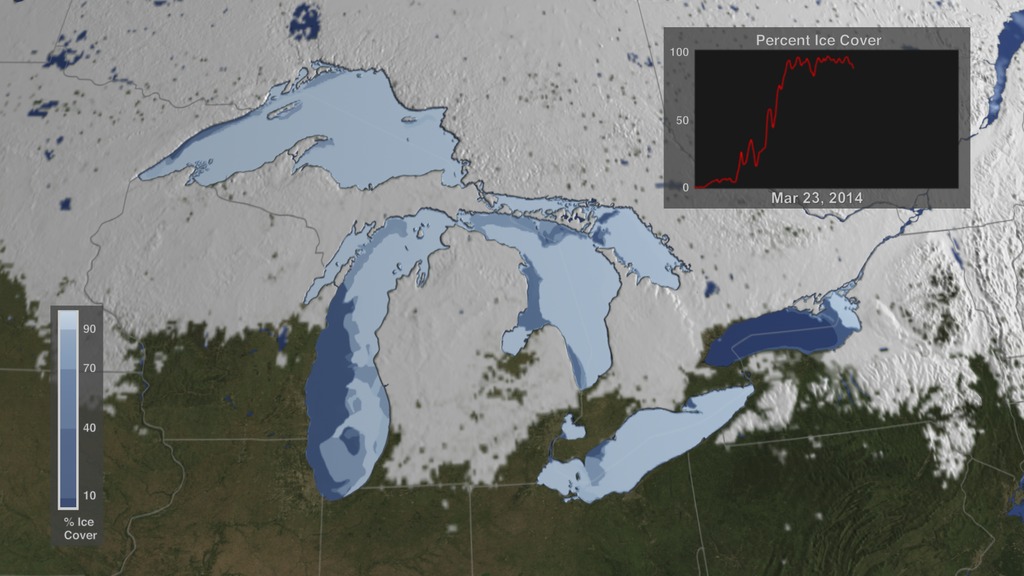
The Winter of 2013 – 2014: A Cold, Snowy and Icy Winter in North America
This animation shows the snow cover over North America during the 2013-2014 winter as well as the ice concentration over the Great Lakes. The date and a graph showing the percent of ice cover over the Great Lakes and Lake Superior is shown on this version. file size is 5.2 MB
Snow Cover & Sea Ice Animation
This animation shows the advance and retreat of daily snow cover along with daily sea ice surface temperature globally from September 2002 through May 2003. file size is 31MB
Surface Temperature of the Greenland Ice Sheet During the Summer of 2005
This animation shows daily surface temperature of the Greenland ice sheet from May 1 through September 1, 2005. An overlay contains a date bar, a color bar and text labels. file size is 14MB
Daily Snow and Sea Ice Temperature over the North Pole
This animation shows the daily advance and retreat of snow cover, and sea ice surface temperature over the North Pole during the winter of 2002-2003. file size is 31MB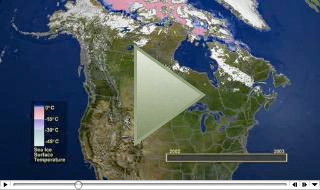
Daily Snow and Sea Ice Temperature over North America
This animation shows the daily advance and retreat of snow cover, and sea ice surface temperature over North America during the winter of 2002-2003. file size is 15MB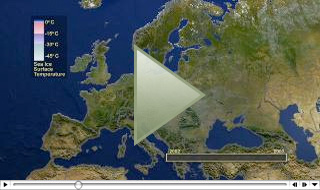
Daily Snow and Sea Ice Temperature over Europe
This animation shows the daily advance and retreat of snow cover, and sea ice surface temperature over Europe during the winter of 2002-2003. file size is 31MB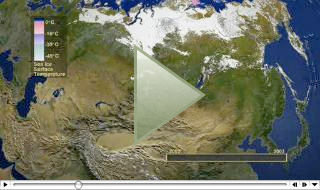
Daily Snow and Sea Ice Temperature over Asia
This animation shows the daily advance and retreat of snow cover, and sea ice surface temperature over Asia during the winter of 2002-2003. file size is 7MB
Development of a Technique to Assess Snow-Cover Mapping Errors from Space
D. K. Hall1, J. L. Foster1, V. V. Salomonson,2, A. G. Klein3and J.Y.L. Chien4
1, Code 974, 2, Code 900, NASA/Goddard Space Flight Center, Greenbelt, MD 20771
301-614-5771 phone,
301-614-5808 fax,
dhall@glacier.gsfc.nasa.gov
3 Department of Geography, Texas A&M University, College Station, TX 77843-3147
4 General Sciences Corporation, Laurel, MD 20707
ABSTRACT
Following the December 18, 1999, launch of the Earth Observing System (EOS) Terra satellite, daily, snow-cover mapping is performed automatically at a spatial resolution of 500 m, cloud-cover permitting, using Moderate Resolution Imaging Spectroradiometer (MODIS) data. This paper describes a technique for calculating global-scale snow-mapping errors, and provides estimates of Northern Hemisphere snow-mapping errors based on prototype MODIS snow-mapping algorithms. Field studies demonstrate that under cloud-free conditions when snow cover is complete, snow-mapping errors are small (<1%) in all land covers studied except forests where errors are often greater and more variable. Thus the accuracy of Northern Hemisphere snow-cover maps is largely determined by percent of forest cover north of the snowline. From the 17-class International Geosphere-Biosphere Program (IGBP) land-cover maps of North America and Eurasia, we classify the Northern Hemisphere into seven land-cover classes and water. Estimated snow-mapping errors in each of the land-cover classes are extrapolated to the entire Northern Hemisphere for areas north of the average continental snowline for each month. The resulting average monthly errors are expected to vary, ranging from about 5 — 10%, with the larger errors occurring during the months when snow covers the boreal forest in the Northern Hemisphere. As determined using prototype MODIS data, the annual average estimated error of the future Northern Hemisphere snow-cover maps is approximately 8% in the absence of cloud cover. Preliminary error estimates will be refined after MODIS data have been available for about one year.
INTRODUCTION
Weekly snow-cover maps have been produced of the Northern Hemisphere using visible and near-infrared satellite data since 1966 [1]. In addition, passive-microwave data have been used to produce snow-cover and snow-depth maps of the Northern Hemisphere [2], [3]. While it has been recognized that snow maps are more accurate in some land covers than in others [3], there has been no attempt to assess the accuracy of the maps in individual land covers and to use that information to assess hemispheric or global-scale errors. The need for error assessment is heightened by the 1999 launch of the National Aeronautics and Space Administration's (NASA's) Terra satellite, on which the Moderate Resolution Imaging Spectroradiometer (MODIS) sensor is flown. MODIS data will be used to produce daily, global snow-cover map products at a spatial resolution of 500 m. Other products will also be available. The users of these snow maps will require knowledge of the errors inherent in the snow mapping. This paper presents a technique for assessment of the errors of the hemispheric-scale MODIS snow-cover maps.
An algorithm has been developed to map global snow cover using MODIS data. Prototype algorithms have been applied to Landsat Thematic Mapper (TM), and National Oceanographic and Atmospheric Administration (NOAA) Advanced Very High Resolution Radiometer (AVHRR) satellite data, and MODIS Airborne Simulator (MAS) data to simulate snow cover mapping with MODIS data. Detailed studies of the prototype at-launch MODIS snow-mapping algorithms have been conducted in several different land covers, and associated errors have been determined in several land-cover classes [4], [5]. Early results using actual MODIS data have provided similar results.
In this work, the Earth's land surface has been classified into seven land-cover classes and water. Using the percentage of each land-cover class north of the position of the average monthly continental snowline, we have estimated average monthly snow-mapping errors for North America and Eurasia, for individual land-cover classes.
The inability to map snow cover through dense forests is an important limitation to snow-cover mapping from space. For the purposes of this paper, this limitation is considered in the error estimates. Not considered are the limitations on mapping snow cover using MODIS during darkness and through cloud cover.
Knowledge of the errors of hemispheric-scale snow-cover maps is important because MODIS snow cover products will be used as input to snowmelt-runoff models [6] and general circulation models (GCMs) [7]. Errors of the input products must be known to establish the errors of the output products.
BACKGROUND
Description of MODIS and the primary snow-cover mapping products
NASA's Terra spacecraft was launched into a sun-synchronous, near-polar orbit with a 10:30 a.m. equatorial-crossing time on December 18, 1999. Its five scientific instruments, including the MODIS, permit monitoring of the energy exchanges among the atmosphere, oceans and land [8].
MODIS is a 36-band spectroradiometer covering visible, near-, shortwave-infrared and infrared bands from 0.4-14 mm [9]. A swath of data covers an area 2330 km across track and 10 km along track (at nadir). The spatial resolution of the MODIS data ranges from 250 m to 1 km. Among the key land-surface objectives are to map global vegetation and land cover, global land-surface change, vegetation properties, surface albedo, surface temperature and snow and ice cover daily or every-other-day [10], [11], [12].
The MODIS snow-mapping algorithm will map global snow cover, cloud-cover permitting, at 500-m spatial resolution using MODIS data [5], [13], [14]. MODIS snow and ice data products will be archived at and distributed by the National Snow and Ice Data Center (NSIDC) in Boulder, Colorado [15] beginning in the fall of 2000.
Each MODIS pixel is mapped as snow, cloud or "other." The MODIS cloud mask at 1-km resolution, developed at the University of Wisconsin [16], is input to the snow-mapping algorithm. The snow-mapping algorithm [5], which has evolved over time, will include sub-pixel snow cover information within the first year following the launch.
Validation of the MODIS global snow-mapping algorithm
The MODIS-derived Northern Hemisphere snow maps will be compared extensively with other hemispheric-scale maps such as the Northern Hemisphere weekly snow-cover maps produced by the National Environmental Satellite, Data and Information Service (NESDIS), and regional-scale 1-km resolution National Operational Hydrologic Remote Sensing Center (NOHRSC) snow maps [17]. MODIS maps will also be compared with maps derived from passive-microwave data [2], [18]. These comparisons reveal only relative error because the absolute errors of the NESDIS, NOHRSC and passive-microwave snow maps have not been established. At local scales, MODIS snow-cover maps will be compared with snow-cover maps derived from the Landsat-7 Enhanced Thematic Mapper Plus (ETM+) and Terra's Advanced Spaceborne Thermal Emission and Reflection Radiometer (ASTER) data, at a spatial resolution of up to 15 m.
Prototype instruments
The TM, a near-nadir-viewing sensor, �7.5°, was first carried on the Landsat-3 satellite in 1982 with a 16-day repeat cycle. It provides 30-m pixel resolution images of the Earth's surface in seven spectral bands, ranging from the visible to the thermal-infrared parts of the spectrum. A TM scene represents an area of 185 X 185 km on the ground. The MODIS prototype algorithm for TM uses TM bands 2 (0.52-0.60 mm), 4 (0.76-0.9 mm) and 5 (1.55-1.75 mm).
The MAS acquires imagery in 50 channels ranging from the visible to the thermal-infrared parts of the spectrum (0.527 - 14.35 mm), but the MODIS prototype algorithm uses only MAS channels 1-9 (Table 1). The MAS collects image data with a ground resolution of 50 m from 20,000-m altitude, and has a cross-track scan width of 85.92° giving a total field of view of 37.25 km on the ground [19].
Field measurements
An ongoing series of field and aircraft experiments for validation of the MODIS snow algorithm has allowed us to determine the accuracy of the MODIS prototype snow maps in individual land covers [4], [5] and [13]. Studies of snow-cover mapping accuracy under conditions of complete snow cover in a number of different land covers have been conducted. Simultaneous field and aircraft campaigns have been undertaken in forests and prairies (grasslands) in Saskatchewan [5], agricultural and forested areas in Minnesota and Wisconsin, tundra and forests in northern and central Alaska and forests in New York and New Hampshire [4], [20], [21], [22], [23].
A limitation contributing to the reported error, is the fact that less snow in forests will be mapped at off-nadir view angles than at nadir. This is because, when viewed from an angle, the tree stems, branches and trunks block the view of the snow more than when the forest is viewed from nadir. Often, when viewing a snow-covered forest from the air, little or no snow cover will be seen, especially if there is no snow in the tree canopy. The prototype studies done using the near-nadir-viewing TM sensor have not taken this into account.
METHODOLOGY
Land-cover classification
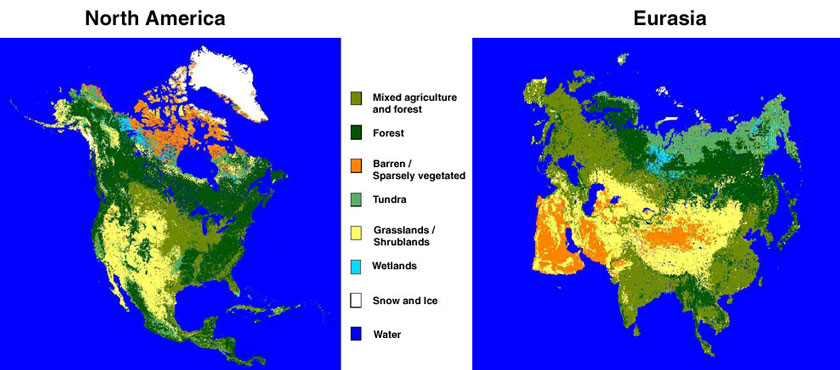
International Geosphere-Biosphere Project (IGBP) 17-class land-cover maps of North America and Eurasia, that have been developed from 1-km AVHRR data, are used as the base maps for this work. These products are based on monthly normalized difference vegetation index (NDVI) composites from 1992 and 1993 [24]. Since the snow-mapping errors are not believed to be vastly different in many of the 17 original IGBP classes, the IGBP maps were modified for this work to encompass only seven common land-cover classes in the Northern Hemisphere (Table 2): forest, mixed agriculture and forest, barren/sparsely vegetated, tundra, grasslands/shrublands, wetlands, permanent snow and ice, and water (Figure 1).
Determination of snow-mapping error estimates in forested areas
Efforts have been concentrated on determining snow-mapping errors in forests. Errors vary with forest-cover density, being very low in sparse forests, and higher in dense forests, both coniferous and deciduous [4], [5]. The accuracy of snow mapping depends more on the density of tree canopies rather than on forest type. This has also been shown for passive microwave mapping of snow extent and depth [25], [26].
Snow-cover maps, created using Landsat TM and MAS data for forests in Saskatchewan and central Alaska, have revealed variable accuracies when the MODIS at-launch snow-mapping algorithm was employed [4], [5].
In the Saskatchewan study area alone, snow-mapping errors range from nearly 0 to 43% with the highest errors occurring in dense, deciduous forests [5]. However, the errors of snow cover mapping in forests in Saskatchewan as in other forested areas studied, are generally <5% [5]. Values reported for the Saskatchewan study area were determined by mapping snow cover using the TM prototype algorithm when snow cover was complete; areas mapped as non-snow-covered were considered to be in error, as field measurements revealed complete snow cover.
In central Alaska, snow-mapping errors in forests were determined by field and satellite measurements, using reflectance as a surrogate measure of vegetation-cover density following the work of Robinson and Kukla [27] and Foster et al. [25]. The error associated with snow mapping in the densest vegetation cover in an area of mixed vegetation in central Alaska, was 2% [4]. These errors were determined by mapping snow using the MAS under conditions of complete snow cover, as verified by nearly-simultaneous field measurements.
Forest-cover density maps.
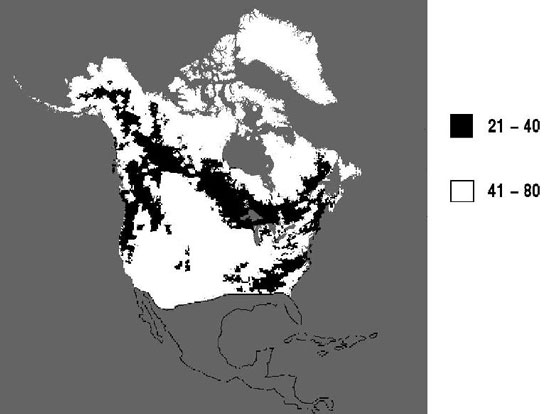
Robinson and Kukla [27], [28] developed a method of estimating vegetation density using Defense Meteorological Satellite Program (DMSP) visible and near-infrared data. They used a linear interpolation between the brightest tundra and the darkest snow-covered forest, and assigned "parameterized albedos" of 0.21 for complete snow cover in very dense coniferous forest, and 0.80 for open tundra or farmland. Figure 2 shows two land-cover classes given by Robinson and Kukla [27], representing their "parameterized albedos" in North America: 1) albedos from 21-40, which are black in Figure 2, are forests, and 2) albedos from 41-80, which are white in less-dense vegetation or barren lands.
A digital comparison of Robinson and Kukla's [27] Northern Hemisphere albedo map, and our seven-class land-cover map shows that areas having the lowest wintertime albedos (e.g., 21-40%) in Figure 2 correspond closely with our forest-cover class as shown in Figure 1. In addition, in the continental United States, the densest forests according to Zhu and Evans [29] correspond closely to the lowest-albedo areas as defined by Robinson and Kukla [27], and the taiga and maritime snow-cover classes of Sturm et al. [30]. Thus, by independent methods, location of forest cover in North America has been established, and different forest-cover densities may be identified. This information may help to determine where the snow-mapping errors within forested areas will be greatest.
Foster et al. [25] found that the satellite-derived reflectance data in snow-covered forested regions was indicative of the actual fractional-forest cover, and used the Robinson and Kukla [27] reflectance measurements as a surrogate measure for assessing the percentage of forest cover in snow-covered terrain in the Northern Hemisphere. Ponce et al. [31] also note a correlation between vegetation density and planetary albedo. Though NDVI, a measure of vegetation biomass, has a close relationship with the photosynthetic capacity of specific vegetation types [32], biomass is not necessarily a useful indicator of forest-cover density. Thus the reflectance and albedo data are more useful for estimating forest-cover density than is NDVI [25].
RESULTS
Error estimates in "forest" and "mixed-agriculture and forest."
A snow-mapping error of 10% is used in this paper for forests even though most of the measured errors are <10% as determined from previous work. An additional 5% error is added to account for errors due to mixed-pixel effects at the borders of the forested areas.
The 5% error estimate due to mixed-pixel effects is based on the following. If a forest pixel (with 10% error) is next to a tundra pixel (with 0% error), then we estimate that a mixed-pixel error is 5%. Thus we estimate, empirically, that the errors in forests would average 15% under cloud-free conditions (Table 3).
Snow-mapping errors in the mixed agriculture and forest class are estimated at 5% (assuming that the class is composed equally of forest and agriculture), with an additional 5% error added for mixed-pixel effects, to provide an error of 10% in the mixed agriculture and forest class.
Error estimates in "non-forest" land covers.
Snow-mapping errors in the barren/sparsely vegetated, tundra, grassland/shrubland, wetlands and permanent snow and ice land-cover classes north of the snowline are negligible. Though specific ground measurements have not been undertaken in all of these areas, measurements in some of the areas (e.g. tundra and grassland/shrubland) have revealed nearly 100% accuracy in measuring complete snow cover.
As was the case with the forests, an additional error of 5% is added to estimates in all classes because of expected errors at the boundaries of land-cover types due to mixed-pixel effects (Table 3). Errors during snowmelt and patchy-snow conditions will contribute to the total errors, however we have undertaken only a few field measurements in patchy-snow conditions [23], and thus do not have much information on snow-mapping errors in patchy-snow cover. While it is important to establish snow-mapping errors in patchy snow, error estimates must first be established in complete snow cover. Errors in patchy-snow cover are likely to be greater and are currently being studied [33].
Other snow-mapping errors.
Studies have shown that the TM prototype algorithm correctly mapped mineral deposits around Mono Lake, California as non-snow-cover. Furthermore, actual MODIS-derived maps show that we do not misidentify deserts (e.g. the Sahara) as snow cover. However, early MODIS data show some non-snow pixels mis-identified as snow, and these pixels are being studied.
Monthly snowline positions.
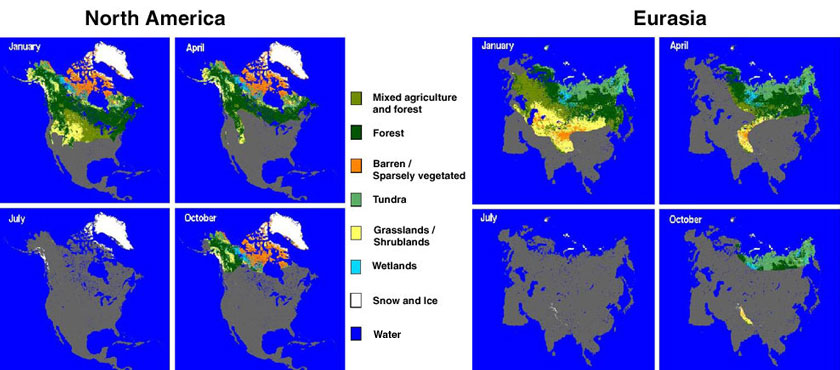
Average monthly-snowline positions in North America and Eurasia are reported by NOAA/NESDIS on their Northern Hemisphere weekly snow-cover maps. In Figure 3, the average monthly snowline positions are shown for the months of January, April, July and October for North America and Eurasia; the land-cover classes are seen north of the average continental snowline for each month.
To determine an error for North America for the month of January, the following formula may be applied:
��� �� 7
����������� ����������� EJAN = ELC S A���������� ����������������������� ����������� ����������� [1]
��������������������������������������� ��i=1
where EJAN is the average January snow-mapping error, ELC is the error in each of the seven land-cover classes (from Table 3), and A is the percent area of each land-cover type above the snowline in January in this case (from Table 4). Each of the monthly errors may be calculated. Monthly errors may then be averaged to derive an estimate of an average annual error.
Expected preliminary snow-mapping errors
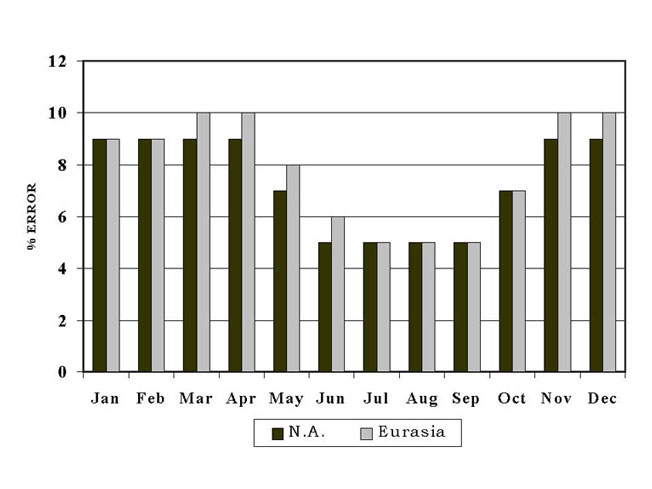
On the basis of these preliminary data, the greatest errors in snow mapping can be expected from November through April (9-10%) as shown in Figure 4. It is during those months that snow covers most or all of the boreal forests and most of the forests located in the mid-continent regions. Though the snowline begins to retreat northward by March/April, snow cover in forests lasts longer than it does in open areas. In April, with snow still remaining in the forests, and a smaller total snow-covered area, both in North America and Eurasia, the percentage of snow in forests is high (39 and 45%, respectively), (Table 4) and the error contribution of the forests is significant.
As estimated in this work, the aggregated, Northern Hemisphere snow-mapping error (in the absence of cloud cover) is about 8%, and is largely determined by the percentage of forest that is snow covered in a given month.
DISCUSSION AND CONCLUSION
This work has shown that hemispheric errors resulting from satellite snow-mapping vary depending on the position of the snowline and the percentage of forest cover.
In order to assess the errors of global snow cover mapping using future MODIS data, it is first necessary to determine the errors in mapping snow in individual land covers. Preliminary snow-mapping error estimates were derived from Landsat TM satellite, MAS aircraft and simultaneous field measurements in forested, agricultural, prairie and tundra areas in North America using prototype MODIS snow-mapping algorithms. When the ground is completely snow covered, snow-mapping errors using the prototype versions of the MODIS at-launch algorithm are found to be very small (<1%) in the non-forest land covers, and larger and more variable in forests.
In our seven-class land-cover map of the Northern Hemisphere, the forest-cover class corresponds very well with the lowest "albedos" delineated on a map of Northern Hemisphere albedo produced by Robinson and Kukla [27].
The estimated snow-mapping errors for the seven land-based cover classes are: 15% for the forested areas, 10% for mixed agricultural and forest areas and, 5% for each of the other five classes. The errors derived for each land cover were extrapolated to the hemispheric scale to estimate the expected monthly and annual errors in mapping snow using MODIS snow maps. Errors are estimated to be greatest between the months of November and April in North America (9%), and Eurasia (9-10%), when snow completely covers the boreal forest. The resulting average annual snow-mapping error for the Northern Hemisphere is estimated to be approximately 8%, excluding errors induced by cloud cover.
In the near future, it should be possible to use MODIS-derived reflectances, in conjunction with MODIS-derived vegetation maps, to delineate the densest stands within the forested areas. This will allow an improved estimate of snow-mapping errors in forests to be determined.
This work has provided a technique for estimating snow-mapping errors at the hemispheric scale, though actual errors cannot yet be determined. These rough error estimates will be refined after about one year of MODIS data are available.
ACKNOWLEDGMENTS
The authors thank Dr. David Robinson/Rutgers University, for providing us with the Defense Meteorological Satellite Program (DMSP) "surface albedo" data of North America and Eurasia, and Dr. Alan Strahler/Boston University for discussions about the IGBP land-cover maps. We also thank Dr. Claire Parkinson at NASA/GSFC for her comments on the manuscript.
REFERENCES
[1] M. Matson, C. F. Ropelewski and M. S. Varnadore, "An atlas of satellite-derived northern hemisphere snow cover frequency," National Weather Service, Washington, D.C., 75 pp., 1986.
[2] A. T. C. Chang, J. L. Foster and D. K. Hall, "Nimbus-7 derived global snow cover parameters," Annals of Glaciology, vol. 9, pp. 39-44, 1987.
[3] M. T. Hallikainen, "Retrieval of snow water equivalent from Nimbus-7 SMMR data: effect of land-cover categories and weather conditions," IEEE Journal of Oceanic Engineering, vol. OE-9, pp. 372-376, 1984.
[4] D. K. Hall, J. L. Foster, D. L. Verbyla, A. G. Klein and C. S. Benson, "Land and forest cover classification using aircraft and satellite data in snow-covered areas in central Alaska," Remote Sensing of Environment, vol. 66, pp. 129-137, 1998.
[5] A. G. Klein, D.K. Hall and G.A. Riggs, "Improving snow-cover mapping in forests through the use of a canopy reflectance model," Hydrological Processes, vol. 12, no. 10-11, pp. 1723-1744, 1998.
[7] G. E. Liston, "Interrelationships between snow distribution, snowmelt, and snowcover depletion: implications for atmospheric, hydrologic, and ecologic modeling," Journal of Climate, submitted.
[8] Y. J. Kaufman, D. D. Herring, K. J. Ranson and G. J. Collatz, "Earth observing system AM1 mission to Earth," IEEE Transactions on Geoscience and Remote Sensing, vol. 36, no. 4, pp. 1045-1055, 1998.
[9] W. L. Barnes, T. S. Pagano and V. V. Salomonson, "Prelaunch characteristics of the Moderate Resolution Imaging Spectroradiometer," IEEE Transactions on Geoscience and Remote Sensing, vol. 36, no.4, pp. 1088-1100, 1998.
[10] V.V. Salomonson, D. L. Toll and W. T. Lawrence, "The moderate resolution imaging spectrometer (MODIS) and observations of the land surface," Proceedings of the IGARSS �92 Symposium, 26-29 May 1992, pp. 549-551, 1992.
[11] S. W. Running, C. O. Justice, V. V. Salomonson, D. K. Hall, J. L. Barker, Y. J. Kaufman, A. H. Strahler, A. R. Huete, J.-P. Muller, V. Vanderbilt, Z. M. Wan, P. Teillet and D. Carneggie, "Terrestrial remote sensing science and algorithms planned for EOS/MODIS," International Journal of Remote Sensing, vol. 15, no. 17, pp. 3587-3620, 1994.
[12] C.O. Justice and 22 others, "The Moderate Resolution Imaging Spectroradiometer (MODIS): Land Remote Sensing for Global Change Research," IEEE Transactions on Geoscience and Remote Sensing, vol. 36, no. 4, pp. 1228-1249, 1998.
[13] D. K. Hall, G. A. Riggs and V. V. Salomonson, "Development of methods for mapping global snow cover using Moderate Resolution Imaging Spectroradiometer (MODIS) data," Remote Sensing of Environment, vol. 54, pp. 127-140, 1995.
[14] Riggs, G. A., D. K. Hall and V. V. Salomonson, "Recent progress in development of the Moderate Resolution Imaging Spectroradiometer snow cover algorithm and product," Proceedings of IGARSS'96, Lincoln, NE, pp.139-141, 1996.
[15] Scharfen, G.R., Hall, D.K., S.J.S. Khalsa, J.D. Wolfe, M.C. Marquis, G.A. Riggs and B. McLean, "Accessing the MODIS snow and ice products at the NSIDC DAAC, "Proceedings of IGARSS'00, 23-28 July 2000, Honolulu, HI, in press.
[16] S. A. Ackerman, K. I. Strabala, W. P. Menzel, R. A. Frey, C. C. Moeller and L. E. Gumley, "Discriminating clear-sky from clouds with MODIS," Journal of Geophysical Research, submitted.
[17] T. R. Carroll, "Operational airborne and satellite snow cover products of the National Operational Hydrologic Remote Sensing Center," Proceedings of the 47th Eastern Snow Conference, 7-8 June, 1990, Bangor, Maine, CRREL Special Report 90-44, 1990.
[18] N. C. Grody, and A. N. Basist, "Global identification of snowcover using SSM/I measurements," IEEE Transactions on Geoscience and Remote Sensing, vol. 34, No. 1, pp.237-249, 1996.
[19] M. D. King, W. P. Menzel and 10 others, "Airborne scanning spectrometer for remote sensing of cloud, aerosol, water vapor, and surface properties," Journal of Atmospheric and Oceanic Technology, vol. 13, no. 4, pp. 777-794, 1996.
[20] A. G. Klein, D. K. Hall and K. Seidel, "Algorithm intercomparison for accuracy assessment of the MODIS snow-mapping algorithm," Proceedings of 55th Eastern Snow Conference, 3-5 June 1998, Jackson, NH, pp. 37-45, 1998.
[21] A. B. Tait, D. K. Hall, J. L. Foster and A. T. C. Chang, "Detection of snow cover using millimeter-wave imaging radiometer (MIR) data," Remote Sensing of Environment, vol. 68, pp. 53-60, 1999.
[22] K. J. Bayr, J. C. Goumas and K. A. Picard, "Description of snow measurements — February 9, 1997, Keene, New Hampshire area: Tenant Swamp, Spofford Lake and Bretwood Golf Course," internal report, Department of Geography, Keene State College, Keene, NH, 1998.
[23] D. K. Hall, A. B. Tait, J. L. Foster, A. T. C. Chang and M. Allen, "Intercomparison of Satellite-Derived Snow-Cover Maps," Annals of Glaciology, in press.
[24] T. R. Loveland, and A. S. Belward, "The IGBP-DIS global 1 km land cover data set, DESCover: first results," International Journal of Remote Sensing, vol. 18, no. 15, pp. 3289-3295, 1997.
[25] J. L. Foster, A. T. C. Chang and D. K. Hall, "Snow mass in boreal forests derived from a modified passive microwave algorithm," Multispectral and Microwave Sensing of Forestry, Hydrology, and Natural Resources, E. Mougin, K. J. Ranson and J.A. Smith (ed.), 26-30 September 1994, Rome, Italy, pp. 605-617, 1994.
[26] A. T. Chang, J. L. Foster, D. K. Hall, B. E. Goodison, A. E. Walker, J. R. Metcalfe and A. Harby, "Snow parameters derived from microwave measurements during the BOREAS winter field campaign," Journal of Geophysical Research, vol. 102, no. D4, pp. 29,663-29,671, 1997.
[27] D. A. Robinson and G. Kukla, "Maximum surface albedo of seasonally snow-covered lands in the Northern Hemisphere," Journal of Climate and Applied Meteorology, vol. 24, pp. 402-411, 1985.
[28] D. A. Robinson and G. Kukla, "Albedo of a dissipating snow cover," Journal of Climate and Applied Meteorology, vol. 23, pp. 1626-1634, 1984.
[29] Z. Zhu and D. L. Evans, "U.S. forest types and predicted percent forest cover from AVHRR data," International Journal of Remote Sensing, vol. 60, no. 5, pp. 525-529, 1994.
[30] M. Sturm, J. Holmgren and G. E. Liston, "A seasonal snow cover classification system for local to regional applications," Journal of Climate, vol. 8, no. 5, pp. 1261-1283, 1995.
[31] V. M. Ponce, A. K. Lohani and P. T. Huston, "Surface albedo and water resources: hydroclimatological impact of human activities," Journal of Hydrologic Engineering, vol. 2, no. 4, pp. 197-203, 1997.
[32] J. R. G. Townshend, C. J. Tucker and S. N. Goward, "Global vegetation mapping," In Atlas of Satellite Observations Related to Global Change, R. J. Gurney, J. L. Foster and C. L. Parkinson (eds.), Cambridge University Press, London, England, pp. 301-311, 1993.
[33] J. C. Shi, "1999 Progress Report: Validation Snow Extent Product from MODIS Data," progress report to NASA, ICESS, UCSB, 8 p., 1999.
List of Figures