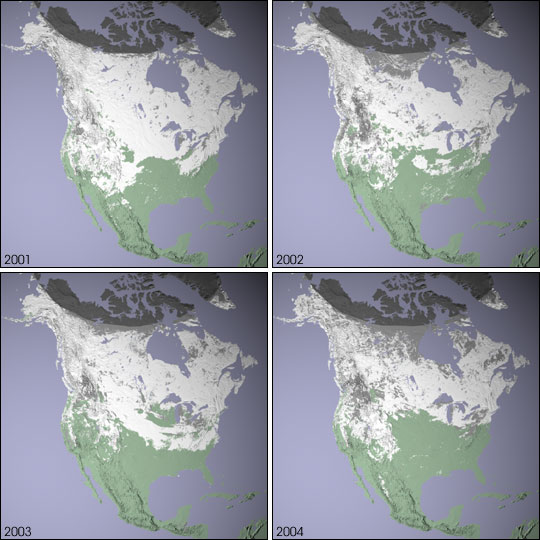
The four snow maps shown above were derived using data from the Moderate Resolution Imaging Spectroradiometer (MODIS), flying aboard NASA's Terra satellite. Each map represents maximum snow cover in North America during the same 8-day period in each of four consecutive years (2001-04). White regions represent snow cover, green shows land areas not covered by snow, and blue is water. The light gray patches are areas where no data were collected due to persistent cloud cover and the dark gray semi-circle at the top of the image shows where no data were available due to the polar night. Though this 8-day period (January 17-24) is not necessarily representative of the entire winter, the maps reveal there can be large year-to-year changes in snow cover.
The average January snow cover for North America is 17.0 million square kilometers (6.6 million square miles) according to NOAA/NESDIS, based on data acquired since 1973. The snow cover (17.2 million square km) in January 2001 was considerable, especially in the western United States where snow cover reached as far south as the Texas panhandle, and into the mid-western United States. The year 2002 had less extensive snow cover (16.3 million square km). For January 2003, North American snow cover averaged 16.0 million square km. While this total is less than in the two previous years, snow cover was greater in the Middle Atlantic States and in the Northeastern U.S. than in either 2002 or 2001. Both January 2002 and 2003 were a little below the normal January snow cover. This past January (2004), in several regions of the United States, snow has been extensive, and the average snow cover extent was 17.2 million square km, which is the same as in January 2001. In 2004, below-normal temperatures in the northeast have kept snow on the ground for many weeks.