More Information
view allVideos
Videos
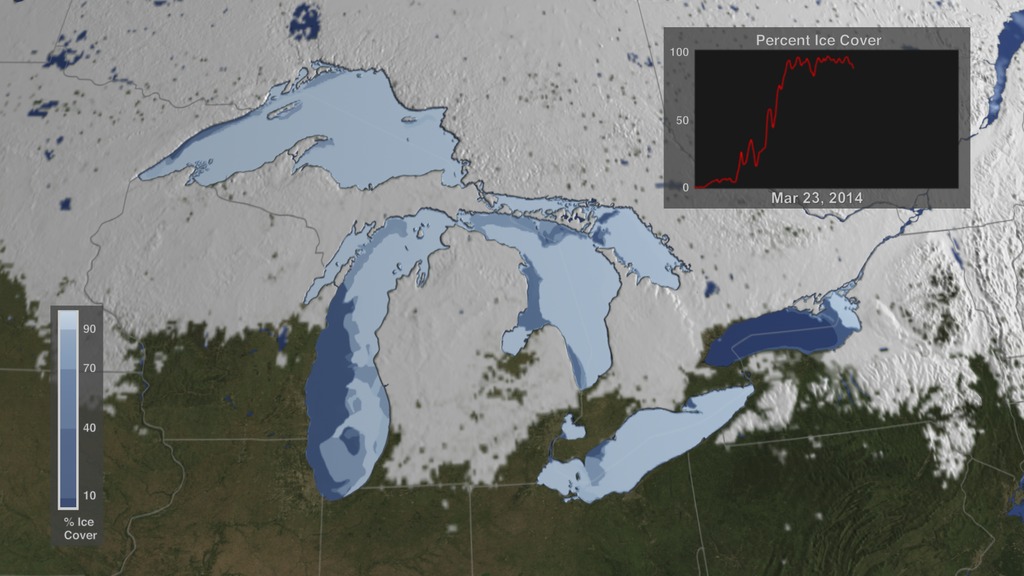
The Winter of 2013 – 2014: A Cold, Snowy and Icy Winter in North America
This animation shows the snow cover over North America during the 2013-2014 winter as well as the ice concentration over the Great Lakes. The date and a graph showing the percent of ice cover over the Great Lakes and Lake Superior is shown on this version. file size is 5.2 MB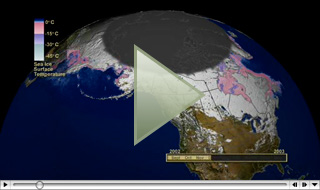
Snow Cover & Sea Ice Animation
This animation shows the advance and retreat of daily snow cover along with daily sea ice surface temperature globally from September 2002 through May 2003. file size is 31MB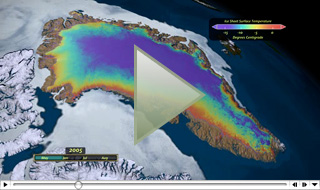
Surface Temperature of the Greenland Ice Sheet During the Summer of 2005
This animation shows daily surface temperature of the Greenland ice sheet from May 1 through September 1, 2005. An overlay contains a date bar, a color bar and text labels. file size is 14MB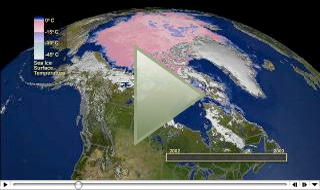
Daily Snow and Sea Ice Temperature over the North Pole
This animation shows the daily advance and retreat of snow cover, and sea ice surface temperature over the North Pole during the winter of 2002-2003. file size is 31MB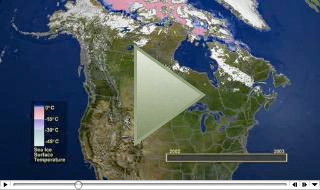
Daily Snow and Sea Ice Temperature over North America
This animation shows the daily advance and retreat of snow cover, and sea ice surface temperature over North America during the winter of 2002-2003. file size is 15MB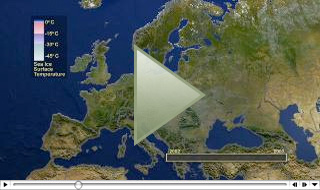
Daily Snow and Sea Ice Temperature over Europe
This animation shows the daily advance and retreat of snow cover, and sea ice surface temperature over Europe during the winter of 2002-2003. file size is 31MB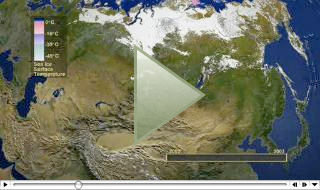
Daily Snow and Sea Ice Temperature over Asia
This animation shows the daily advance and retreat of snow cover, and sea ice surface temperature over Asia during the winter of 2002-2003. file size is 7MB
Thermal and geometric thresholds in the mapping of snow with MODIS
Jonathan S. Barton | Dorothy K. Hall | George A. Riggs
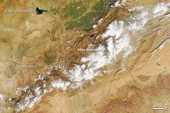
One of the problems facing the MODIS snow-mapping algorithm is the mapping of snow in regions where it is known not to exist. One of the more common locations for this problem is in dark forests, particularly in the tropics. The nature of the snow-mapping algorithm is such that it is particularly sensitive to small changes in the NDSI or NDVI over dark, heavy vegetation, and can more easily be tricked by various agents. Speculatively, a list of these agents might include aerosols in the atmosphere above the canopy; water under the canopy, a common occurrence in many rainforests; shadows of clouds falling on the canopy; and clouds that have not been identified by the MODIS cloud mask.
 |
||||||||
| Figure 1. Distribution of 11.03µm thermal brightness temperature for 350,000 pixels falsely identified as snow in nine scenes of central Africa.
To correctly map these areas of tropical forest as snow-free, the 11.03µm thermal infrared band was used to estimate the surface temperature of the ground. This band was selected because it represents an atmospheric window, in which little of the emitted thermal radiation is absorbed by the atmosphere. The distribution of brightness temperatures was determined for a population of more than 360,000 misidentified pixels taken from nine five-minute granules of central Africa in February 2001. The mean of this sample fell at 289.3K, and 99% of the population lay greater than 279.5K. (Figure 1.) The distribution of brightness temperatures for a population of more than 3,500,000 pixels, assumed to be all correctly identified, from two scenes of northern North America was determined for comparison. These data, in a bimodal distribution, had a mean of 267.9K and 99% of the pixels had brightness temperatures less than 275.9. (Figure 2.) Using these results, a tentative threshold has been set for 277K, which lies between the 99% cutoffs of the two datasets. (Figure 3.) It is possible that some of the pixels in North America were not correctly mapped as snow, but in principle, because the number of snow pixels is so large, if the relatively few incorrectly mapped pixels were removed, it should not substantially alter the distribution. The bimodality of the North American data can be directly attributed to the two different scenes used for the dataset. If more datasets were used, the bimodality might disappear. It is unclear what role weather might play in determining the brightness temperature, and a warm day after a large snowstorm may prove troublesome. When this threshold is applied to the Congo data, it eliminates from 93% to 98% of the incorrectly mapped snow.
|