More Information
view allVideos
Videos
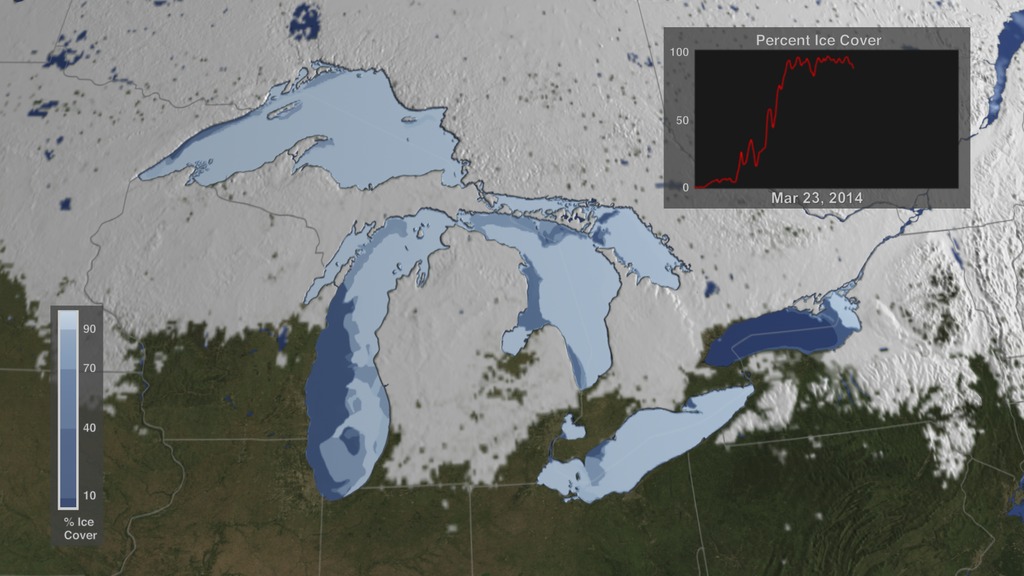
The Winter of 2013 – 2014: A Cold, Snowy and Icy Winter in North America
This animation shows the snow cover over North America during the 2013-2014 winter as well as the ice concentration over the Great Lakes. The date and a graph showing the percent of ice cover over the Great Lakes and Lake Superior is shown on this version. file size is 5.2 MB
Snow Cover & Sea Ice Animation
This animation shows the advance and retreat of daily snow cover along with daily sea ice surface temperature globally from September 2002 through May 2003. file size is 31MB
Surface Temperature of the Greenland Ice Sheet During the Summer of 2005
This animation shows daily surface temperature of the Greenland ice sheet from May 1 through September 1, 2005. An overlay contains a date bar, a color bar and text labels. file size is 14MB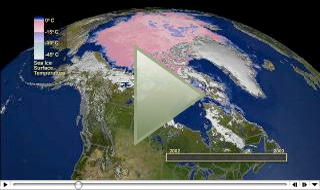
Daily Snow and Sea Ice Temperature over the North Pole
This animation shows the daily advance and retreat of snow cover, and sea ice surface temperature over the North Pole during the winter of 2002-2003. file size is 31MB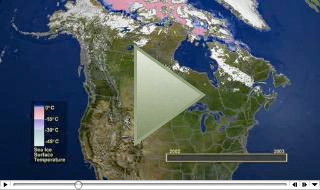
Daily Snow and Sea Ice Temperature over North America
This animation shows the daily advance and retreat of snow cover, and sea ice surface temperature over North America during the winter of 2002-2003. file size is 15MB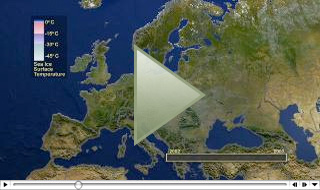
Daily Snow and Sea Ice Temperature over Europe
This animation shows the daily advance and retreat of snow cover, and sea ice surface temperature over Europe during the winter of 2002-2003. file size is 31MB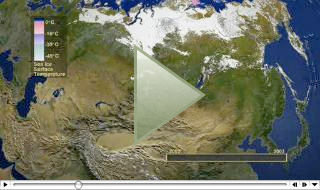
Daily Snow and Sea Ice Temperature over Asia
This animation shows the daily advance and retreat of snow cover, and sea ice surface temperature over Asia during the winter of 2002-2003. file size is 7MB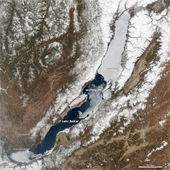
Error Analysis for Global Snow-Cover Mapping in the Earth Observation System (EOS) Era
D.K. Hall1, J.L. Foster1, V.V. Salomonson2, A.G. Klein3and J.Y.L. Chien4
1, 2 Code 974, Code 900, NASA/Goddard Space Flight Center, Greenbelt, MD 20771
301-286-6892 phone
301-286-1758 fax
dhall@glacier.gsfc.nasa.gov
3 Universities Space Research Corporation, Seabrook, MD 20706
4 General Sciences Corporation, Laurel, MD 20707
ABSTRACT
Following the launch of the Earth Observing System (EOS) satellite platform, daily, global snow-cover mapping will be performed automatically at a spatial resolution of 500 m using Moderate Resolution Imaging Spectroradiometer (MODIS) data. In order to estimate the accuracy of the MODIS snow maps, the Northern Hemisphere was divided into 7 land-cover classes and water, and expected errors in mapping snow were calculated for each of the 7 classes using the average monthly snowline position. The errors are found primarily in land covers composed of forests. Maximum monthly snow-mapping errors are expected to range from 5 - 9% for North America, and from 5 - 10% for Eurasia. The largest errors are expected when snow coverage in the Boreal Forest is greatest. The maximum aggregated snow-mapping error for the Northern Hemisphere is expected to be about 7.5%. Error estimates will be refined after the first full year that MODIS data are available.
INTRODUCTION AND BACKGROUND
The Earth Observing System (EOS) satellite platform is planned to be launched in the summer of 1998. Daily, global snow- and ice-cover mapping will be performed automatically at a spatial resolution of 500 m using EOS Moderate Resolution Imaging Spectroradiometer (MODIS) data [1-3]. The accuracy of the at-launch algorithms will be assessed, and in addition, the accuracy of the resulting snow-cover maps will be assessed through comparisons with other snow maps and from ground and aircraft measurements. The accuracy of snow-cover mapping will depend on land-cover type, sensor parameters and the algorithm employed. The greatest uncertainty in snow-cover mapping accuracy using the MODIS at-launch algorithm is expected to be found in the Earth's forested regions [4].
The MODIS at-launch snow-cover maps will be used, along with other data, by hydrological modelers in order to make predictions of water supply and flooding, and by general circulation modelers and climatologists to study the Earth's energy balance and climate. Errors in snow-cover mapping must be quantified because they will contribute to errors in model output.
METHODOLOGY
Using the EROS Data Center (EDC) land-cover maps of North America and Eurasia [5], we have classified the Earth's land surface into 7 different classes as follows: forest, mixed agriculture and forest, barren/sparsely vegetated, tundra, grassland/shrublands, wetlands and snow/ice (Figure 1 and Figure 2). Snow-mapping errors, derived using MODIS prototype algorithms, for most of the 7 classes were determined from previous field, aircraft and satellite studies. The average monthly snowline positions were obtained from the NOAA National Environmental Satellite, Data and Information Service (NESDIS) [6,7]. The snowline positions were registered to land-cover maps and the percent of each of the 7 land covers north of the continental snowline was calculated monthly for North America and Eurasia. Using the information on snowline position and snow-mapping error estimates in the various land covers, hemispheric snow-mapping errors were calculated by making the assumption that the errors are uniform within each class. While this is not an entirely valid assumption, it allows us to make a preliminary estimate of global snow-cover mapping accuracy.
RESULTS AND DISCUSSION
Of all the land-cover classes, it is most difficult to map snow in forests. The land cover that we call forests is composed of both coniferous and deciduous forests. Extensive coniferous and deciduous forests, called the Boreal Forest, encircle North America and Eurasia. Coniferous, deciduous and mixed forests are also extensive in the eastern part of the United States and in central Europe.
Estimating snow-mapping errors is also most difficult in forests, and the resulting errors are the most variable of the 7 classes (Table 1). This is because forests partially or completely conceal the underlying snow cover. Snow-cover measurements using Landsat Thematic Mapper (TM) and MODIS Airborne Simulator (MAS) data over forests in southern Saskatchewan and Alaska have revealed highly variable accuracies in snow mapping when the ground is continuously snow covered. Using the MODIS prototype snow-mapping algorithms, errors ranged from nearly 0 to 43%, the larger errors attributable to denser forests [2,8]. However, the errors in forests are generally <10% [2]. We assume an additional 5% error due to the combined effect of mixed-pixel effects at the boundaries of the forested areas, and possible errors resulting from measuring snowcover during the snowmelt period. We have not studied snow-mapping errors over partially snow-covered lands. We estimate that the maximum error in mapping snow in forests, globally, will average 15%.
The mixed agriculture and forest cover tends to be found in the central and eastern United States and over extensive areas of northwestern Eurasia north of the snowline. Using our TM prototype algorithm, we measure snow with nearly 100% accuracy in agricultural areas, and 90% accuracy in forests (see previous discussion), so the error in the mixed agriculture and forest areas is estimated to be 5% (assuming an equal contribution from agriculture and forest), plus 5% error to account for the combined effect of mixed-pixel effects and errors under patchy snow conditions, for a total estimated error of 10% for the mixed agricultural and forest areas.
To the following five classes - barren/sparsely vegetated, tundra, grassland/shrubland, wetlands and snow/ice - field, aircraft and/or satellite measurements reveal negligible errors in snow mapping using the TM and MAS MODIS prototype snow-mapping algorithms. Thus for these areas, described below, we assign a minimum error of 5% to account for possible errors due to mixed-pixel effects and/or snow-mapping errors during patchy snow conditions.
The greatest errors in snow mapping can be expected from about November through April (9-10%) as shown in Table 2. It is at these times that snow covers most or all of the boreal forests and many of the forests located in the mid-continent regions. The maximum aggregated snow-mapping error for the Northern Hemisphere is expected to be about 7.5%.
CONCLUSION
The maximum expected MODIS snow-mapping errors for 7 land-cover types range from 5% for barren/sparsely-vegetated lands, tundra, grassland/shrubland, wetlands, and permanent snow/ice, to 15% for forests. These errors were used to estimate the expected maximum monthly and annual errors in Northern Hemisphere snow mapping using the MODIS at-launch algorithm. The error is expected to be highest when snow covers the Boreal Forest, roughly between November and April. The maximum, aggregated Northern Hemisphere snow-mapping error is expected to be about 7.5%. Errors will be refined after we acquire the first year of MODIS global snow-cover data, and are expected to be less than the preliminary errors.
REFERENCES
[1] Hall, D.K., G.A. Riggs and V.V. Salomonson, 1995. Development of methods for mapping global snow cover using Moderate Resolution Imaging Spectroradiometer (MODIS) data, Remote Sensing of Environment, 54:127-140.
[2] Klein, A.G., D.K. Hall and G.A. Riggs, in press: Improvmg snow-cover mapping in forests through the use of a canopy reflectance model, Hydrological Processes.
[3] Riggs, G.A., D.K. Hall and S.A. Ackerman, in press: Sea ice detection with the Moderate Resolution Imaging Spectroradiometer Airborne Simulator (MAS), submitted to Remote Sensing of Environment.
[4] Foster, J.L., G. Liston, R. Koster, R. Essery, H. Behr, L. Dumenil, D. Verseghy, S. Thompson, D. Pollard and J. Cohen, 1996: Snow cover and snow mass intercomparisons of general circulation models and remotely sensed datasets, Journal of Climate, 9(2):409-426.
[5] Loveland, T.R., and A.S. Belward, 1997: The IGBP-DIS global 1 km land cover data set, DESCover: first results, International Journal of Remote Sensing, 18(15):3289-3295.
[6] Matson, M., C. Ropelewski and M. Varnadore, 1986: An atlas of satellite derived Northern Hemisphere snow cover frequency, Department of Commerce, Wash., D.C.. 75 pp.
[7] NOAA/National Environmental Data and Information Service (NESDIS) weekly snow-cover maps of the Northern Hemisphere, and monthly departure from average maps.
[8] Hall, D.K., J.L. Foster, A.T.C. Chang, C.S. Benson and J.Y.L. Chien, 1998: Determination of snow-covered area in different land covers in central Alaska, U.S.A., from aircraft data - April 1995, Annals of Glaciology, 26.
List of Figures
Figure 1
Figure 2
|